

Reports (now featuring regression analysis for appraisers)
Dynamo MC comes with several ready-made reports that can easily be generated using your market data, and some directly assist with regression analysis for appraisers. These reports may be individually added to your appraisal report, and are available in a variety of different colors. The reports available in Dynamo MC are shown and described below (in default colors).
GLA Regression Analysis
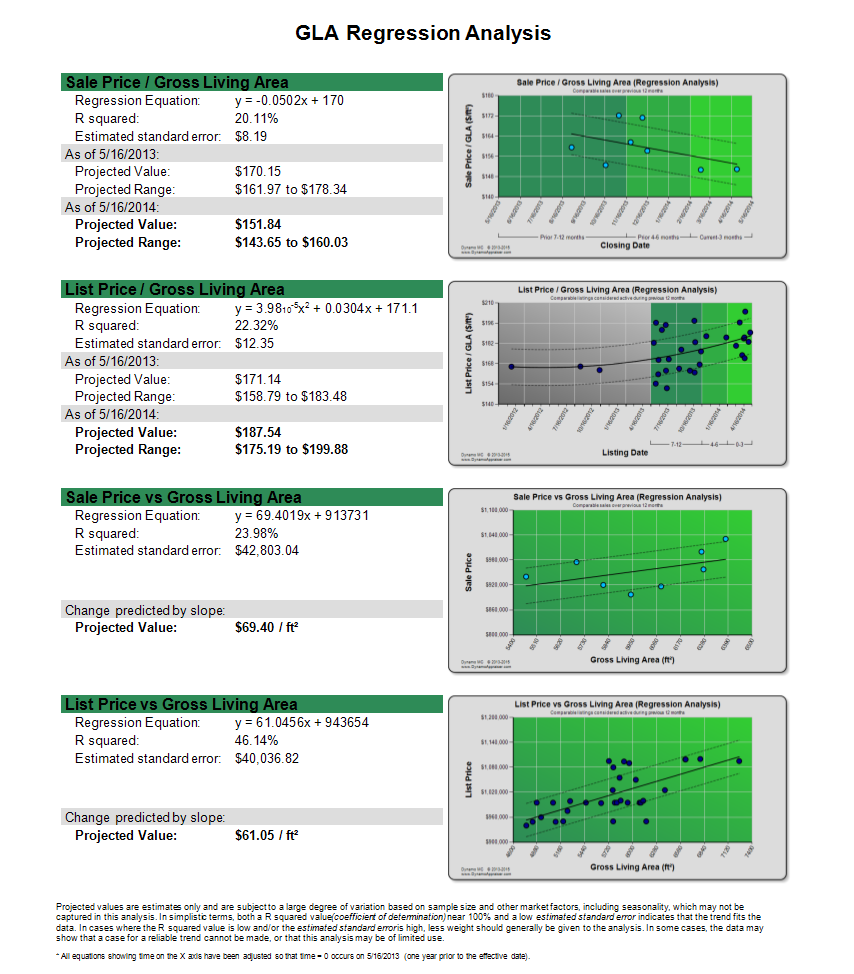
The “GLA Regression Analysis” report provides a more detailed breakdown of Gross Living Area related measurements using single regression analysis for appraisers.
The “Price / Gross Living Area” sections can show the change in price per square foot over time. A regression trend line is displayed to indicate the overall trend, and the upper and lower error bounds are also shown. Projections are made using the trend line shown on each chart. These projects are made at the beginning and end time periods on the chart as a single value, and also as a range by considering the estimated standard error.
The “Price vs Gross Living Area” sections can show how much a price can be expected to rise or fall as the size of the home changes. The projected value is derived directly from the slope of the trend line (which in this case is the change in price per square foot). This is the most dependable when the properties being considered do not vary significantly from each other in attributes other than living area. This analysis includes all properties listed during the year considered, and does not adjust for time in the analysis.
Please note that the selected regression type (linear or polynomial) will only be applied to the top two charts (Price/Gross Living Area) on this report. The bottom two charts (Price vs Gross Living Area) will always be shown using linear regression.
For all sections, regression analysis metrics are shown to describe how well the trend line fits the data*.
Market Regression Analysis
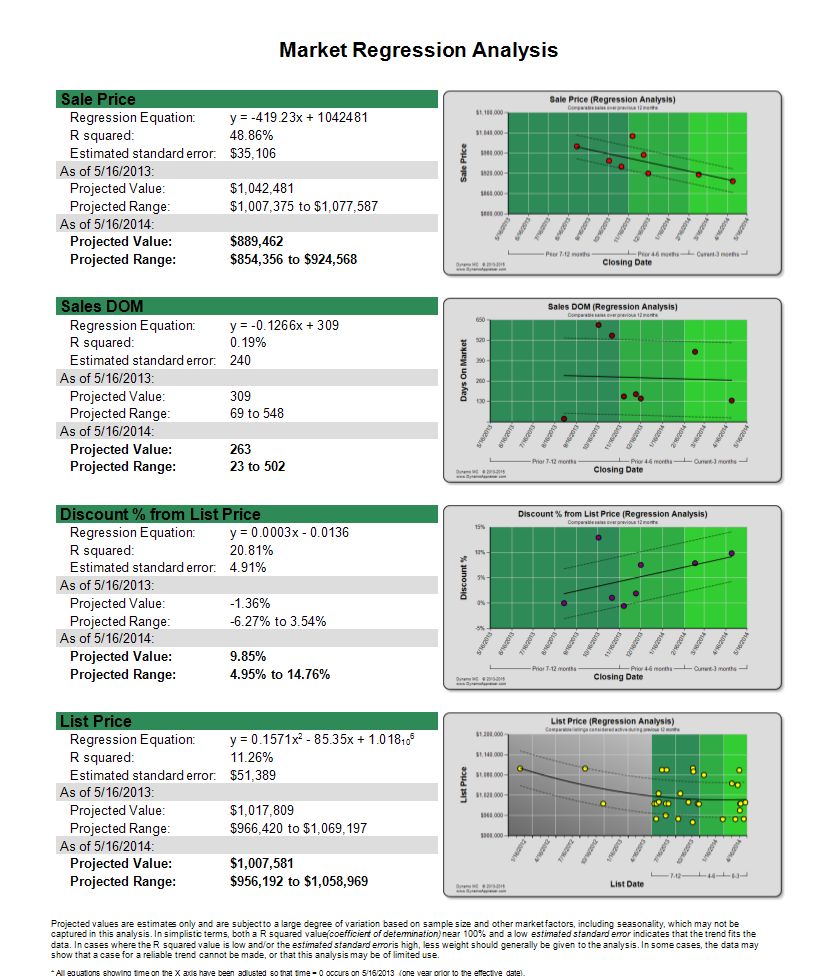
The “Market Regression Analysis” report provides a more detailed breakdown of key market metrics using single regression analysis for appraisers.
The “Sale Price” section shows how the closing price for sold properties has changed during the time period, which can help to show rising or falling market values. The “Sales DOM” section shows how long sold properties have remained active on the market prior to selling, which can help determine changes in typical marketing times. The “Discount % from List Price” section shows the percent change in price that properties have been marked down (and sometimes up) on the market prior to ultimately selling. This can identify when an under or over supply is prevalent in the market. The “List Price” section shows how the listing price for active properties has changed during the time period, which can also be helpful in analyzing market values, and possibly also help in identifying spikes in demand.
For each section, a regression trend line is displayed to indicate the overall trend, and the upper and lower error bounds are also shown. Projections are made using the trend line shown on each chart. These projects are made at the beginning and end time periods on the chart as a single value, and also as a range by considering the estimated standard error.
Please note that the selected regression type (linear or polynomial) will be applied to all charts on this report.
For all sections, regression analysis metrics are shown to describe how well the trend line fits the data*.
Express Summary
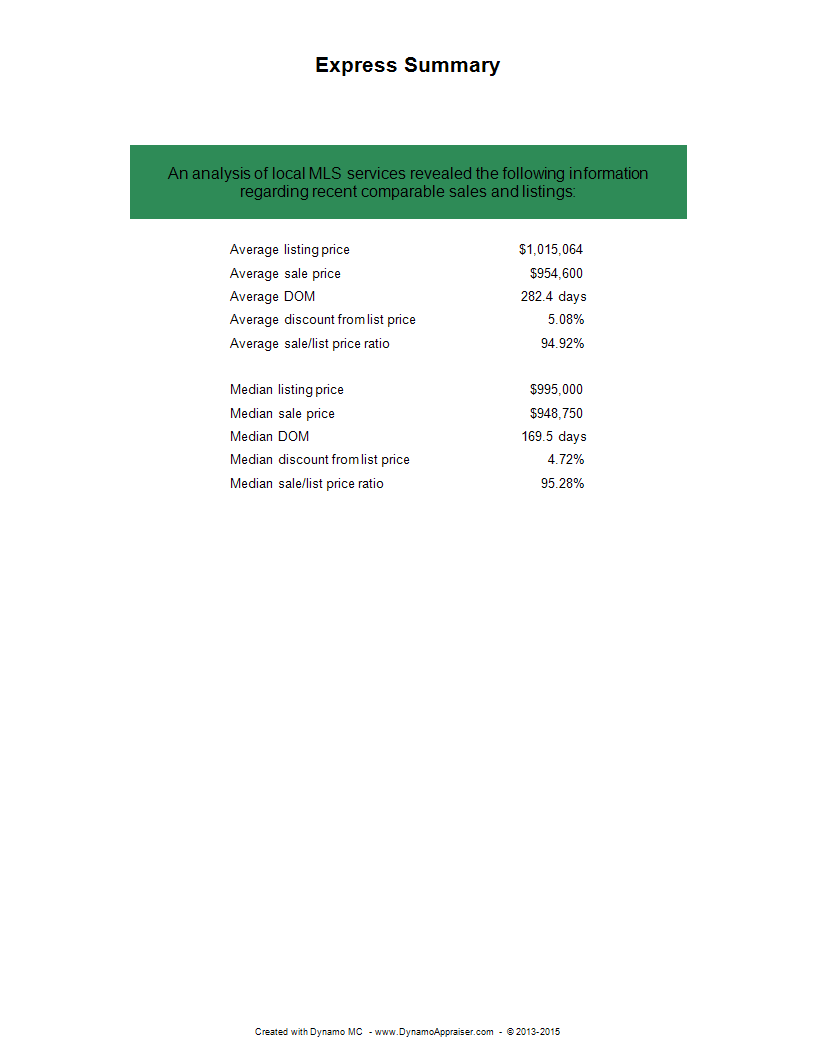
The “Express Summary” report provides a basic summary of the most critical information across the entire market. This includes both median and average values for listing price, sale price, days on market, and discounts observed among closed sales.
Comparables Considered
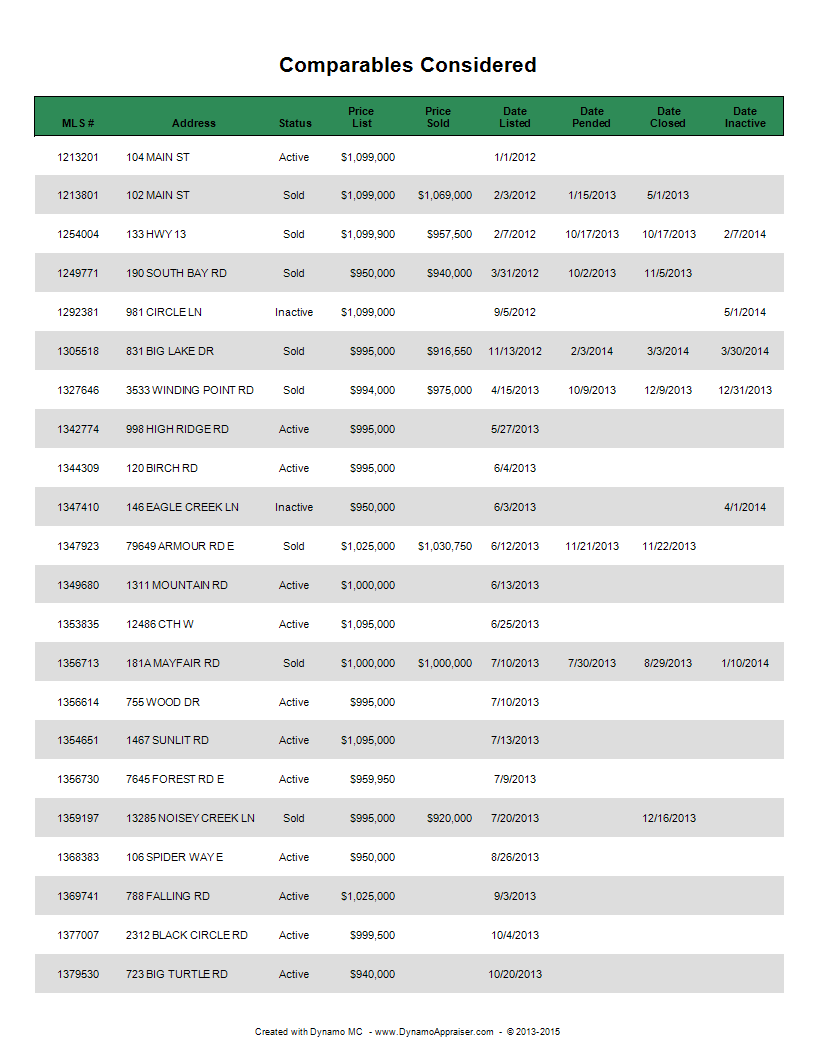
The “Comparables Considered” report shows which properties were selected by the appraiser and entered into Dynamo MC for analysis. The report shows the descriptive information for each property and also the relevant prices and marketing dates. This report is often useful when providing lenders and AMC’s with the list of properties that were considered to be part of the subject’s market. This report will commonly span multiple pages, so it may not always be best to include it in your appraisal report when large numbers of comparable properties are analyzed. (However, it can be a good idea to export this report to your workfile, so it can be accessed later if needed.)
Comparables Included
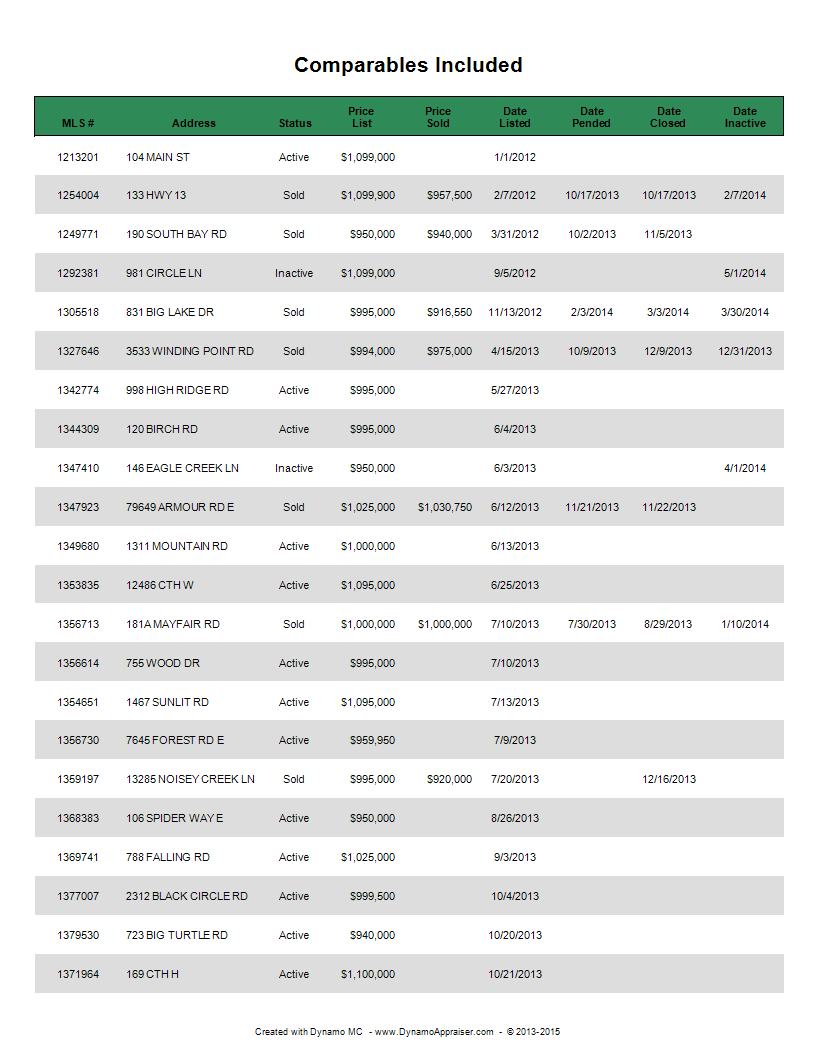
The “Comparables Included” report shows which properties were included in the market analysis by Dynamo MC based on the marketing dates and statuses for each property. This is a subset of the properties provided in the “Comparables Considered” report. Properties sometimes can not be included in the analysis due to being outside the time periods that the 1004 MC is concerned with, so some properties from the “Comparables Considered” report may not be shown on this list. The report shows the descriptive information for each property and also the relevant prices and marketing dates. This report will commonly span multiple pages, so it may not always be best to include it in your appraisal report when large numbers of comparable properties are analyzed. (However, it can be a good idea to export this report to your workfile, so it can be accessed later if needed.)
1004 MC Trend Summary
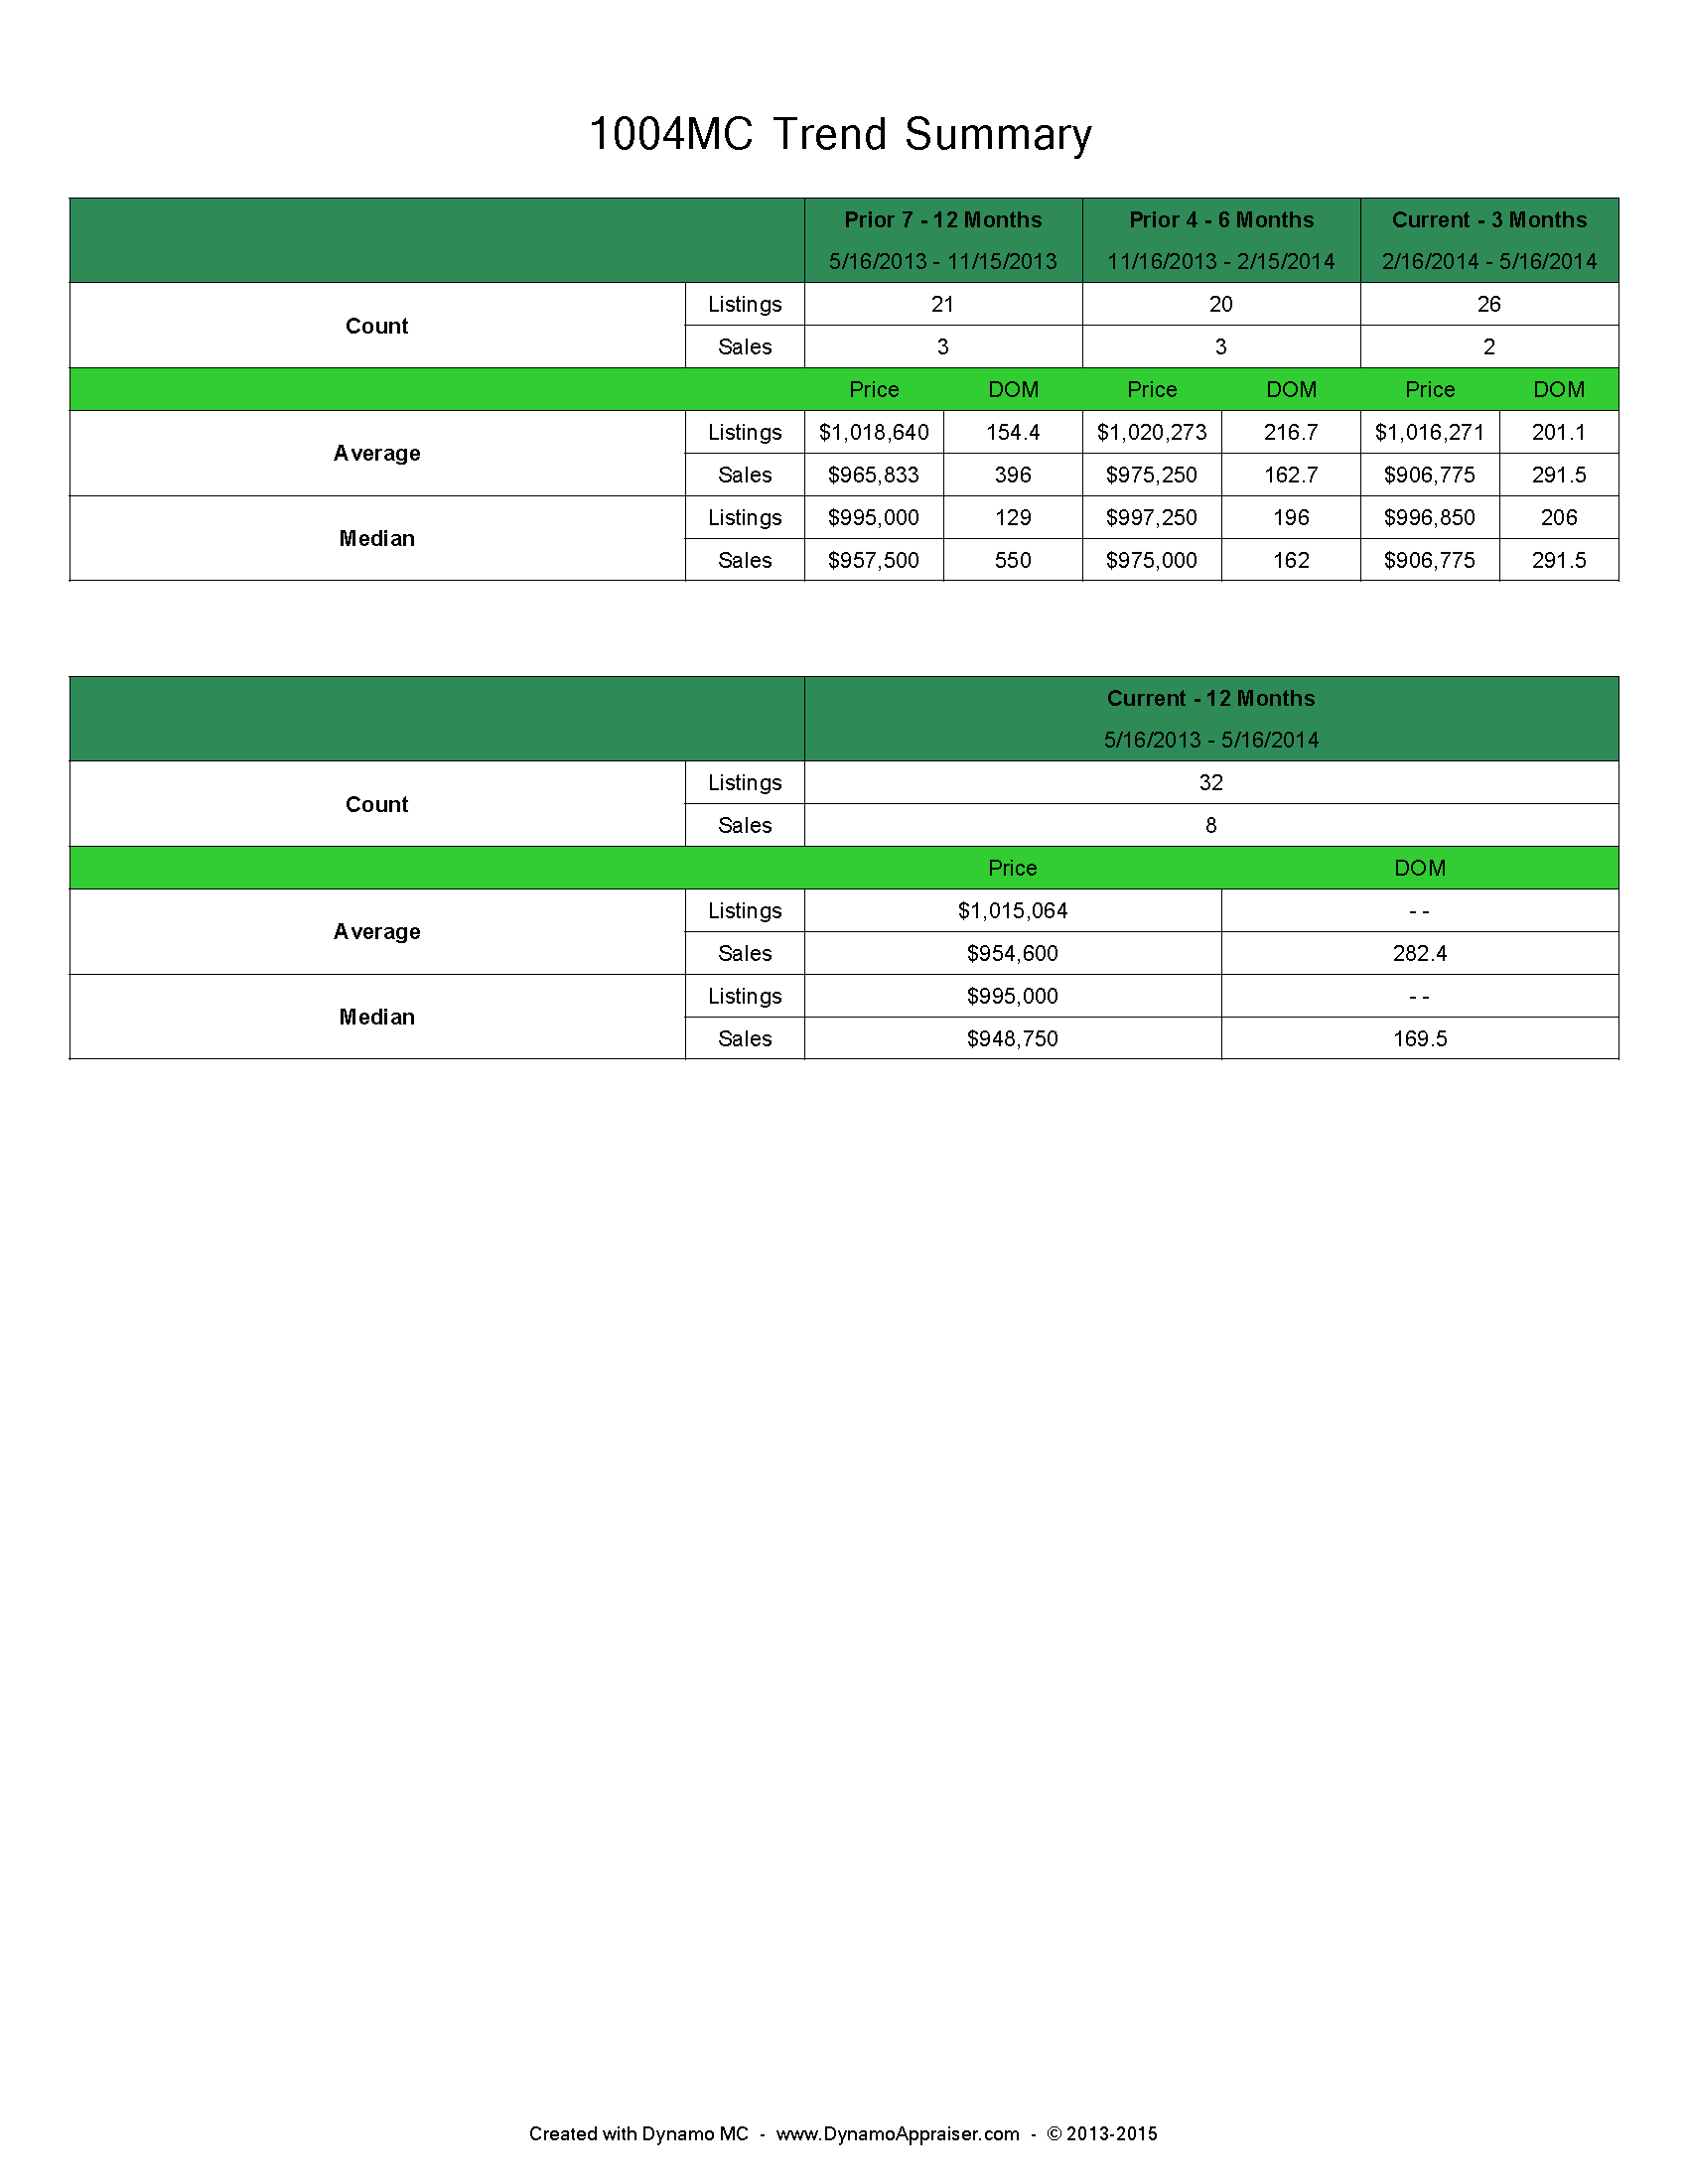
The “1004 MC Trend Summary” report shows an in-depth breakdown of many of the metrics reported on the 1004 MC form. This shows the total counts of the properties considered, and the average and median values of prices and days on market for both sales and listings. These values are considered within the three time periods considered by the 1004 MC in the top table, and within the entire year in the bottom table.
1004 MC Trend Worksheet
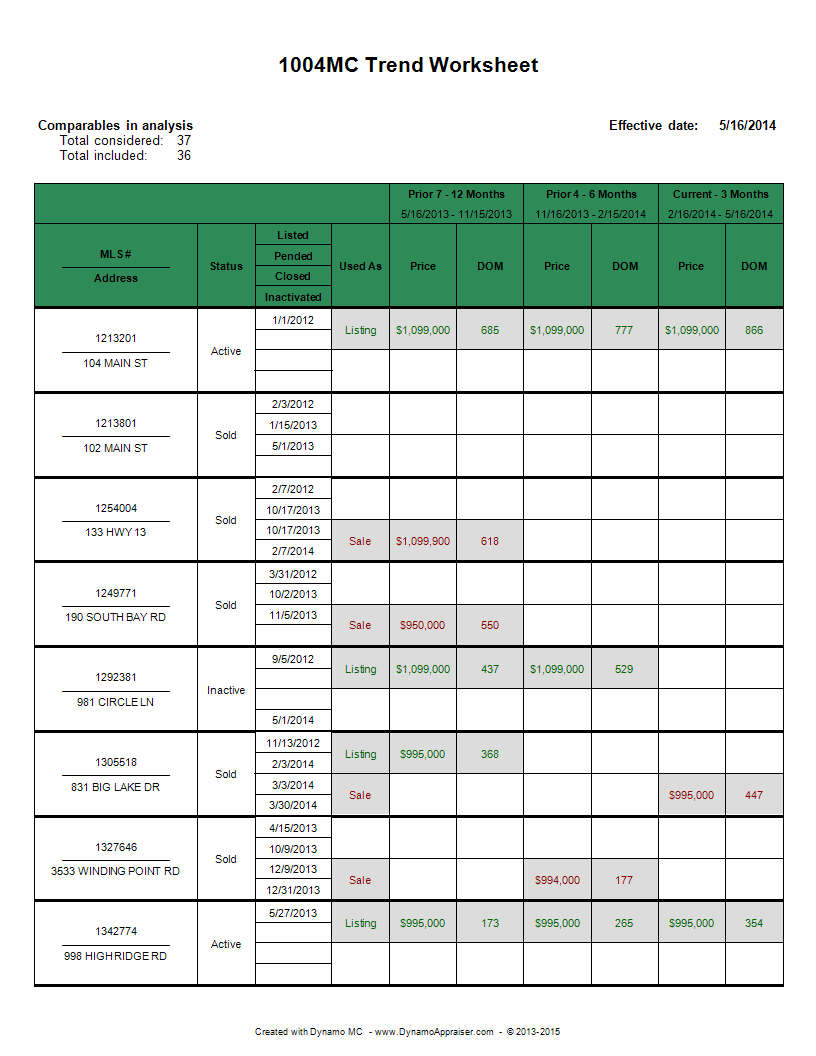
The “1004 MC Trend Worksheet” report shows how each property was considered in determining the 1004 MC form. Properties that were considered as listing are shown in green text in the periods in which they were considered as active according to Fannie Mae rules. Properties that were considered as closed sales are shown in red text in periods in which they were considered sold. It is possible for some properties to be considered as both sales and listings if a closed sale was active during a previous time period. The relevant dates used to calculate each property’s market activity are also shown so that the results can be easily verified. This report will commonly span multiple pages, so it may not always be best to include it in your appraisal report when large numbers of comparable properties are analyzed. (However, it can be a good idea to export this report to your workfile, so it can be accessed later if needed.)
Don’t see the report you need?
Let us know! We’ll consider adding it in a future version of Dynamo MC.
Don’t like the default colors?
That’s not a problem! We have many other color palettes available, so you’ll be able to find colors that work for you. If you have a specific request for colors, please let us know and we will consider adding them in a future version of Dynamo MC.
*Regression Analysis Note – Projected values are estimates only and are subject to a large degree of variation based on sample size and other market factors, including seasonality, which may not be captured in this analysis. In simplistic terms, both a coefficient of determination near 100% and a low estimated standard error indicates that the trend fits the data. In cases where the coefficient of determination is low and/or the estimated standard error is high, less weight should generally be given to the analysis. In some cases, the data may show that a case for a reliable trend cannot be made, or that this analysis may be of limited use.